More Salesforce Report Considerations!
Part II
Introduction
In part 1 of this series, we discussed how to approach reporting in general. This included understanding how to determine the best report type to choose, as well as understanding dynamic date ranges (including dual ranges). Now that we have covered the framework of the report, it is time to move onto approaches to organizing reports.

Report Formats
Depending on the Edition of Salesforce, there is access to four report formats; Tabular, Summary, Matrix, and Joined. Report formats can be changed by clicking on the name of the format type in the report customization screen, and selecting the desired report format.

Tabular report formats are the most straightforward of all four options. This format is similar to an excel document. This is also the default report organization format. It should be noted that Tabular reports cannot be used for Dashboards unless a row limit is applied to the report through the additional option under the “Filter” button in the customization screen of the report. Tabular reports are very useful for looking at the structure of the data, but due to the limitations with dashboards and the more limited capabilities of this report type, they are not used as often as some of the other report types. They can be organized by a single column as well, however they do lack some of the capabilities of the other report formats such as the ability to group and aggregate data.
Summary reports offer vertical groupings, up to three levels deep. While it is not recommended to use all three grouping levels due to the difficulty in reading the report, one and two level groups provide a good level of organization, as well as the ability to aggregate data. When a report format is updated to the Summary format, a new drop zone appears to allow the user to add a grouping level. Click and drag, or click the down arrow next to the field in order to create a grouping.


Matrix reports are the next step up with groupings, offering two levels of both horizontal and vertical grouping. They excel in assisting in the analysis of aggregated data, but are difficult to decipher if left expanded. When working with a matrix report, it is helpful to utilize the hide details functionality. This can be done on the report customization screen by clicking “Show” to the left of the chart button, then unchecking “Details”.

This can also be done on the report detail screen by clicking the “Hide Details” Button.

It is important to note, that once the “Hide Details” button has been clicked, it will become the “Show Details” button, allowing the user to expand the report. Hiding the details collapses all report entries to just the grouping levels. In the case of both the matrix and summary formatted reports, this would just display the record count and any aggregated data.
Joined reports are only available in Enterprise Edition and above. A joined report is two or more report types combined across a common field as a summary style grouping. For report types to be able to be combined, at least one common field must exist. Often times this is the user/owner. Joined reports, themselves, are used to compare two sets of data that would otherwise be unreportable together such as Opportunities created from the Account and Unconverted Leads, where the same user is the owner of both records. Because joined reports are potentially processing more data than would be available in the other report formats, they tend to take longer to process as a whole, and can be difficult to decipher.
Field Considerations
Reporting in Salesforce goes beyond understanding the different report types, and formats, as well as beyond understanding approaching reports. Technically, a report is nothing more than a window into data. The key there is the data. While this is not necessarily in regards to reporting itself, fields and field types should always be considered when reporting. Conversely, reporting should always be considered when creating fields. If the data is not being collected at the field level, it cannot be reported on. If the data is not being collected in a logical manner, it will be very difficult to report on.
Salesforce offers a multitude of field types when creating new, custom fields. Reporting needs will often be the determinant of the type of field being created. Some field types have special attributes when it comes to reporting. Any number, currency, or percent field can provide a sum, average, maximum value, or minimum value. Date and Date/Time fields can be isolated to week, month, day, quarter, or year.
For example, if a user would like to track monthly reoccurring revenue (MRR) from opportunities, they would need to be able to summarize the MRR for a given time period. If the MRR field was created as a text field, this would be quite difficult as opposed to a currency field. This is because of the special properties of any number based field, when it comes to reporting. Number fields cover the standard number field, currency fields, and percent fields.
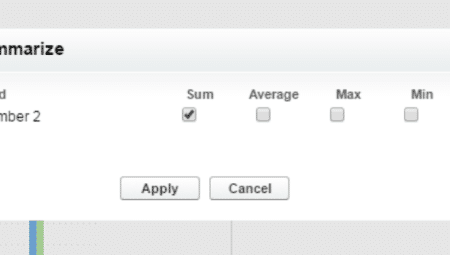
When used on a report, they have the option to be aggregated. The sum, average, maximum value, and/or the minimum value can be reported on at the grouping level. While this does require a report that uses groupings (summary, matrix, or joined), it offers greater insight into the data. This can be done by clicking on the arrow to the right of the number-based field when hovering over it, and clicking “Summarize”.


Tune in next time, where I will continue with field considerations and moving past reporting limitations.
StarrData helps you get the most out of Salesforce. If you would like information on the services we offer, call us at (888) 391-4493 x101.
Don’t forget to check out Part 1 of Reporting Considerations: Familiarizing Yourself!

